
Page 107 - Demo
P. 107
TI Python BootCamp DATA ANALYSE & VISUALISATIE
Het verfijnen van de te plotten grafiek kan als volgt: import ti_plotlib as plt
def venster(xmin,xmax,ymin,ymax,xscale,yscale): ¨¨plt.window(xmin,xmax,ymin,ymax) ¨¨plt.grid(xscale,yscale,"dotted") ¨¨plt.axes("on")
def f(x): ¨¨return x**2
xmin=-5 ; xmax=5 ; ymin=-4 ; ymax=25 venster(xmin,xmax,ymin,ymax,1,2)
pix=20
res=(xmax-xmin)/pix xrange=[xmin+n*res for n in range(1,pix)]
for x in xrange: ¨¨plt.color(255,0,0) ¨¨plt.plot(x,f(x),"o")
¨¨if x < xmax-res: ¨¨¨¨plt.line(x,f(x),x+res,f(x+res))
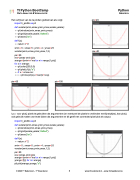
pix=60 pix=100
Python GRAFISCH
pix=20
pix=40
I.p.v. voor plot() pixels te gebruiken als argumenten (en eventueel de pixels te verbinden met lijnstukjes), kan plot() ook gebruik maken van twee lijsten als argumenten en dit geeft een connected pixel plot als output.
import ti_plotlib as plt
def venster(xmin,xmax,ymin,ymax,xscale,yscale): ¨¨plt.window(xmin,xmax,ymin,ymax) ¨¨plt.grid(xscale,yscale,"dotted") ¨¨plt.axes("on")
def f(x): ¨¨return x**2
xmin=-5 ; xmax=5 ; ymin=-4 ; ymax=25 venster(xmin,xmax,ymin,ymax,1,2)
pix=50
res=(xmax-xmin)/pix xrange=[xmin+n*res for n in range(1,pix)] yrange=[f(i) for i in xrange]
plt.plot(xrange,yrange,"o")
© 2020 T3 Nederland – T3 Vlaanderen 3
www.t3nederland.nl – www.t3vlaanderen.be
