Content portal
Hier vindt u leermiddelen voor de STEM-vakken.
Zoek hieronder naar lesmaterialen, gratis activiteiten, video's en publicaties om te gebruiken in de klas.

RGB Array bargraph mathematical analyse
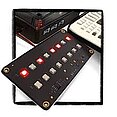
The mathematical analysis to start programming a RGB bargraph on the TI RGB array. The sensor value between 0 and 4096 is divided in a color range from red to orange to yellow and green.
Uitgever: Franklin Neyt, Franklin Neyt
Onderwerp: STEM
Tags Coderen , Complex analysis
To create the colors there is first an increase of green from 0 tot 255 while red is on. Then there is a decrease from 255 to 0 whle green is on. By doing this we are getting the colors RED, ORANGE, YELLOW, LIGHT GREEN and DARK GREEN.
Videos
Standard YouTube license
RGB Array bargraph mathematical analyse

The mathematical analysis to start programming a RGB bargraph on the TI RGB array. The sensor value between 0 and 4096 is divided in a color range from red to orange to yellow and green.
Uitgever: Franklin Neyt, Franklin Neyt
Onderwerp: STEM
Tags Coderen , Complex analysis
To create the colors there is first an increase of green from 0 tot 255 while red is on. Then there is a decrease from 255 to 0 whle green is on. By doing this we are getting the colors RED, ORANGE, YELLOW, LIGHT GREEN and DARK GREEN.